OPS and OPS+ Explained: The Simple Stat That Beat Batting Average
How OBP and slugging combine into OPS, why OPS slightly overrates power, and how OPS+ adjusts for park and league so that 100 means average.
For most of the 20th century, a hitter’s worth was summed up by three numbers on the back of his baseball card: batting average, home runs and runs batted in. Batting average in particular was king. Today, the number you are more likely to see on a broadcast graphic is OPS, and when analysts want to compare hitters across eras and ballparks, they reach for OPS+.
OPS is not the most precise offensive statistic available, but it is easy to calculate, easy to understand and far more informative than batting average. This guide explains how it is built, why it works, where it falls short and how its adjusted cousin, OPS+, puts every hitter on the same scale.
The Problem With Batting Average
Batting average is hits divided by at-bats. It answers one question: how often does a hitter get a hit when he puts the ball in play or strikes out? That leaves out two huge parts of offense.
- Walks and hit-by-pitches. A walk puts a runner on base just like a single in most situations, but batting average ignores it completely, because a walk is not an at-bat.
- Power. Batting average treats a home run exactly the same as a bloop single. Both count as one hit.
Consider two invented hitters with identical .270 averages. One walks rarely and hits mostly singles. The other walks often and hits 35 home runs. Batting average calls them equal; no front office would. That is the gap OPS fills.
The Two Ingredients: OBP and SLG
On-Base Percentage (OBP)
OBP measures how often a hitter reaches base. The formula is:
OBP = (H + BB + HBP) / (AB + BB + HBP + SF)
That is hits plus walks plus hit-by-pitches, divided by at-bats plus walks plus hit-by-pitches plus sacrifice flies. Sacrifice bunts are left out of the denominator, and reaching on an error does not count as reaching base. The key idea: OBP rewards avoiding outs. Outs are the most precious resource in baseball, since every team gets just 27 in a nine-inning game.
Slugging Percentage (SLG)
SLG measures power. Despite the name, it is not a percentage but an average of total bases per at-bat:
SLG = Total Bases / AB
A single counts as one total base, a double two, a triple three and a home run four. A hitter who slugs .500 averages half a base for every at-bat.
Putting Them Together: OPS
OPS stands for “on-base plus slugging,” and the formula is exactly what it sounds like:
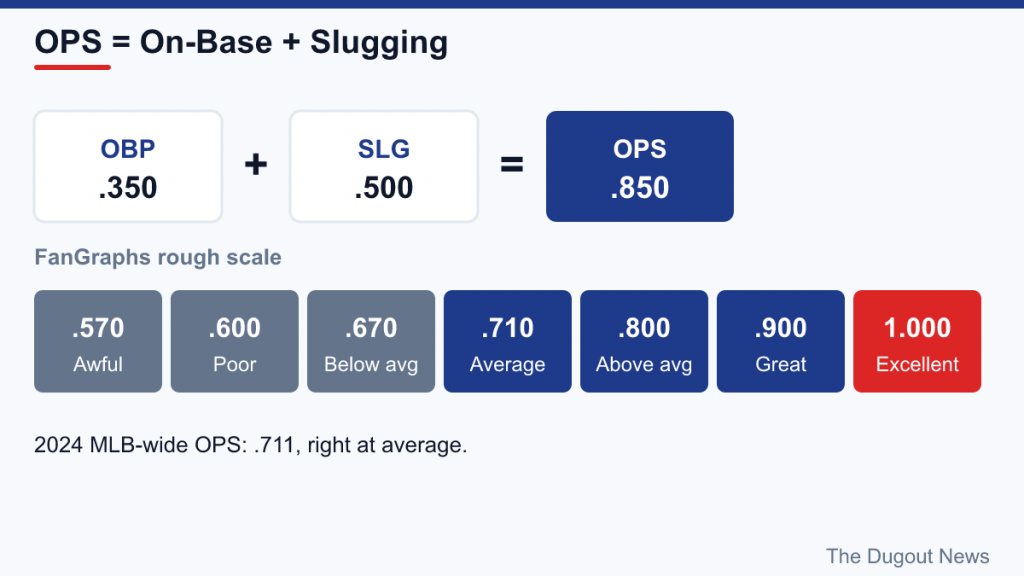
OPS = OBP + SLG
Take an invented hitter with a .350 OBP and a .500 SLG. His OPS is .850.
John Thorn and Pete Palmer popularized the statistic in their 1984 book The Hidden Game of Baseball. It spread through newspapers and broadcasts over the following years, and eventually appeared on baseball cards. Today it is listed on nearly every stats page and broadcast graphic.
What Is a Good OPS?
League-average OPS changes from year to year with the run environment. As a rough guide, FanGraphs offers this scale:
| Rating | OPS |
|---|---|
| Excellent | 1.000 |
| Great | .900 |
| Above average | .800 |
| Average | .710 |
| Below average | .670 |
| Poor | .600 |
| Awful | .570 |
For context, the MLB-wide OPS in 2024 was .711, right at the “average” line. An OPS above .900 over a full season puts a hitter among the best in the game; an OPS of 1.000 or higher is the territory of MVP-caliber seasons.
Why OPS Works So Well
OPS correlates strongly with run scoring at the team level, and it does so with nothing more than numbers printed in any box score. It captures both of the things a hitter can do to create runs: get on base and hit for extra bases. A hitter who walks a lot but has little power, or one with big power but a low OBP, can both post a solid OPS, while a hitter who does neither will be exposed.
It is also intuitive. A fan can add two numbers in their head and get a reasonable read on a hitter in seconds.
Where OPS Falls Short
It Treats OBP and SLG as Equals
The biggest flaw is the weighting. OPS adds OBP and SLG one-to-one, but a point of OBP is worth more than a point of SLG in producing runs. FanGraphs describes OBP as roughly twice as important as slugging. Because of this, OPS slightly overrates power hitters with modest on-base skills and slightly underrates high-OBP hitters.
The two components are not even on the same scale. League-average slugging percentage usually runs 75 to 100 points higher than league-average OBP, so SLG naturally carries more weight in the sum.
It Mixes Denominators
OBP is calculated per plate appearance (roughly), while SLG is calculated per at-bat. Adding two fractions with different denominators is mathematically awkward, even if the result works well in practice.
It Ignores Context
A .800 OPS in a hitter-friendly park during a high-scoring season is not the same as a .800 OPS in a pitcher’s park during a low-scoring era. Raw OPS does not know the difference. That is the problem OPS+ solves.
FanGraphs calls these issues mild and recommends weighted on-base average (wOBA) when more precision is needed, since wOBA assigns each offensive outcome its proper run value.
OPS+: Adjusting for Park and League
OPS+ (sometimes called adjusted OPS) rescales a hitter’s OPS so that 100 is league average, after adjusting for the hitter’s home ballpark and the league’s overall offensive level. It is a staple on Baseball-Reference.
The commonly cited formula is:
OPS+ = 100 × (OBP / lgOBP + SLG / lgSLG − 1)
Here, lgOBP and lgSLG are the league’s on-base and slugging percentages, adjusted for the park. Notice that OPS+ is not just OPS divided by league OPS: each component is compared to the league separately and then combined.
How to Read OPS+
- 100 is exactly league average.
- Each point above or below 100 is roughly a percentage point better or worse than average. An OPS+ of 130 means about 30 percent better than average; an OPS+ of 90 means about 10 percent below average.
- Because it adjusts for park and league, OPS+ can be used to compare players across different teams, seasons and even eras.
A Worked Example
Suppose an invented hitter posts a .360 OBP and .480 SLG in a league where the park-adjusted averages are .320 and .400. His ratios are .360/.320 = 1.125 and .480/.400 = 1.200. Add them (2.325), subtract 1 (1.325) and multiply by 100. His OPS+ is about 133, meaning he was roughly a third better than a league-average hitter.
Notice how the formula’s structure amplifies differences: a hitter 12.5 percent better at getting on base and 20 percent better at slugging ends up 33 percent above average, not 16 percent. That is why OPS+ values for elite hitters can climb well above what their raw OPS might suggest.
OPS vs. Batting Average: The Verdict
| Batting average | OPS | OPS+ | |
|---|---|---|---|
| Counts walks and HBP | No | Yes | Yes |
| Measures power | No | Yes | Yes |
| Adjusts for park and league | No | No | Yes |
| Easy to calculate by hand | Yes | Yes | Needs league and park data |
| Weights outcomes precisely | No | Roughly | Roughly |
Batting average is not useless. It still tells you how often a hitter turns at-bats into hits, and it remains the basis for the batting title. But as a single number for overall offensive value, OPS is far more revealing, and OPS+ is better still when you are comparing players in different contexts.
The All-Time Leaders
Career OPS lists are a who’s who of the game’s greatest hitters, and since MLB began integrating Negro Leagues statistics in 2024, they include several Negro Leagues stars. According to Wikipedia’s compilation of official MLB statistics (minimum 3,000 plate appearances, as of September 30, 2025), the top five in career OPS were:
- Babe Ruth, 1.164
- Ted Williams, 1.116
- Lou Gehrig, 1.080
- Oscar Charleston, 1.064
- Barry Bonds, 1.051
Aaron Judge ranked ninth on that list, the highest among active players. The single-season record belongs to Josh Gibson, with a 1.474 OPS in 1937 for the Homestead Grays; Barry Bonds’s 2004 season (1.422) is the highest outside the Negro Leagues.
How to Use OPS and OPS+ Wisely
- Mind the sample size. OPS swings wildly over a week or two. Wait for several hundred plate appearances before drawing firm conclusions.
- Use OPS+ for comparisons. When comparing players from different teams or seasons, OPS+ removes much of the park and era noise.
- Remember defense and baserunning. OPS measures only hitting. For overall value, look to all-in-one metrics such as WAR, which add fielding, baserunning and positional adjustments.
- Check the components. Two hitters with an .800 OPS can be very different: one might be a .380 OBP / .420 SLG on-base specialist, the other a .300 OBP / .500 SLG slugger. Look at the slash line (AVG/OBP/SLG) as well as the total.
Quick Questions About OPS
- Why is OPS written without a leading zero, like “.850”? Baseball convention drops the zero for rate stats below one, the same way batting averages are written as “.300.” An OPS above 1.000 is written in full.
- Does a sacrifice fly hurt OPS? Slightly. A sacrifice fly counts in the OBP denominator but not in at-bats, so it lowers OBP a little while leaving SLG unchanged.
- Who qualifies for OPS leaderboards? Most leaderboards use the same standard as the batting title: 3.1 plate appearances per team game, which works out to 502 over a 162-game season under the Official Baseball Rules.
- Can OPS+ be below zero? Yes. Because of the “minus 1” in the formula, a hitter who is far enough below average in both on-base and slugging can post a negative OPS+, usually only in a tiny sample, such as a pitcher’s or pinch hitter’s handful of at-bats.
- Is OPS+ the same as wRC+? No. Both use 100 as average and adjust for park and league, but wRC+ is built on wOBA’s run values rather than the OBP-plus-SLG shortcut.
You can calculate a hitter’s OPS for a single game straight from a box score’s batting line and notes; our guide on reading a box score shows where each ingredient lives.