WAR Explained: What Wins Above Replacement Really Measures
What Wins Above Replacement measures, how replacement level works, why FanGraphs and Baseball-Reference disagree, and how to read WAR values.
If you follow modern baseball coverage, you cannot avoid WAR. It shows up in MVP debates, contract analysis, Hall of Fame arguments and trade evaluations. It is also one of the most misunderstood numbers in the sport. Some fans treat it as the final word on a player’s value; others dismiss it as a black box. Neither view is quite right.
WAR, short for Wins Above Replacement, is an attempt to answer a single question: how many wins did this player add to his team compared with the kind of player the team could have found for almost nothing? This guide explains what that means, how the number is built, why different websites publish different WAR values for the same player, and how to use it sensibly.
The Core Idea: Value Over a Freely Available Player
Most traditional stats measure one thing. Batting average measures hits, ERA measures runs allowed, stolen bases measure stolen bases. WAR tries to combine everything a player does on the field, hitting, running, fielding and, for pitchers, run prevention, into one number expressed in wins.
The key design choice is the baseline. WAR does not compare a player to the league average. It compares him to a replacement-level player: the type of player a team can acquire at minimal cost at any time, such as a Triple-A veteran, a waiver claim or a bench player signed for the league minimum. FanGraphs describes WAR as an estimate of how much value a team would lose if a player were replaced by one of these freely available options.
Why not use average as the baseline? Because average players are valuable. A league-average starter who plays every day is worth real money in free agency, and teams cannot simply call one up from the minors. Replacement level reflects the actual alternative a team faces when a player gets hurt or leaves.
What “Replacement Level” Means in Numbers
FanGraphs sets replacement level at a .294 winning percentage. Picture a team made up entirely of replacement-level players: over a 162-game season, it would win roughly 48 games. Every win above that, in theory, is produced by players who are better than replacement.
FanGraphs then distributes a fixed pool of 1,000 WAR per season across the league, with 570 allocated to position players and 430 to pitchers. That fixed pool keeps WAR on a consistent scale from year to year and makes the totals add up: 30 teams of replacement-level players would win about 1,430 games, and the 1,000 WAR fill the gap up to the 2,430 games played in a full season.
The replacement-level concept itself has a long history. Bill James was using the language of replacement level in the early 1980s, and analysts including Pete Palmer, Keith Woolner and Clay Davenport built related frameworks before the modern versions on FanGraphs, Baseball-Reference and Baseball Prospectus took shape.
How Position Player WAR Is Built
For a hitter, WAR is assembled from several components, each measured in runs, then converted to wins. FanGraphs lays out the formula as:
WAR = (Batting Runs + Base Running Runs + Fielding Runs + Positional Adjustment + League Adjustment + Replacement Runs) / Runs Per Win
Here is what each piece does:
- Batting runs measure offensive production compared with average, adjusted for ballpark. A hitter in a hitter-friendly park needs better raw numbers to earn the same credit.
- Base running runs capture stolen bases, caught stealing and the value of taking extra bases, avoiding double plays and other running decisions.
- Fielding runs estimate how many runs a player saved or cost with his glove compared with an average fielder at his position.
- Positional adjustment reflects the difficulty of the position. A shortstop or catcher gets a boost; a first baseman or designated hitter gets a penalty. This is why an average-hitting shortstop can be worth far more than an average-hitting DH. Our guide to the nine baseball positions explains why shortstop and catcher are such premium spots.
- League adjustment is a small correction so the two leagues sit on the same scale.
- Replacement runs add credit for playing time, since every plate appearance a player takes is one that a replacement-level player did not.
The total in runs is then divided by the number of runs it takes to produce one win in that season’s run environment. That figure changes from year to year depending on how much scoring there is, but it is usually around ten runs per win, which is a useful rule of thumb.
How Pitcher WAR Is Built
Pitcher WAR is where the two major public versions diverge the most.
FanGraphs (fWAR)
FanGraphs bases pitcher WAR on FIP, or Fielding Independent Pitching, a stat that uses only strikeouts, walks, hit batters and home runs, the outcomes a pitcher controls most directly. FanGraphs’ version also treats infield fly balls much like strikeouts. FIP is adjusted for park and scaled to innings pitched, then converted to runs above replacement and finally to wins. The logic comes from research by Voros McCracken showing that pitchers have relatively little control over what happens on balls in play, which are heavily influenced by defense and luck.
Baseball-Reference (bWAR or rWAR)
Baseball-Reference starts from the runs a pitcher actually allowed, earned and unearned, and adjusts for the quality of the defense behind him and other context. It answers a slightly different question: what happened, rather than what a pitcher’s underlying skills suggest should have happened.
Relief pitchers present a special case. Because a reliever’s innings are concentrated in high-leverage moments, FanGraphs includes a leverage component for relievers, and a reliever at about +1 WAR in a season is generally considered excellent.
Why fWAR and bWAR Differ
When you see one site list a player at 6.0 WAR and another at 4.8, the discrepancy usually comes from two places:
- Pitching inputs. FIP-based fWAR and runs-allowed bWAR can disagree sharply for pitchers whose results differ from their peripherals, such as a pitcher with a low ERA but an ordinary strikeout-to-walk profile.
- Defensive metrics. Baseball-Reference uses Defensive Runs Saved for modern seasons, while FanGraphs uses Outs Above Average or Ultimate Zone Rating depending on the era. Defensive systems disagree with each other more than offensive ones do.
A famous example came in the 2017 American League MVP race. Aaron Judge led Jose Altuve in fWAR (8.2 to 7.5), while Baseball-Reference had Altuve ahead (8.3 to 8.1). Altuve won the award. Neither number was “wrong”; they were built with different assumptions. Baseball Prospectus publishes a third version, WARP, with its own methods.
The practical lesson: never mix versions in the same comparison. If you compare two players, use the same site’s WAR for both.
How to Read WAR Values
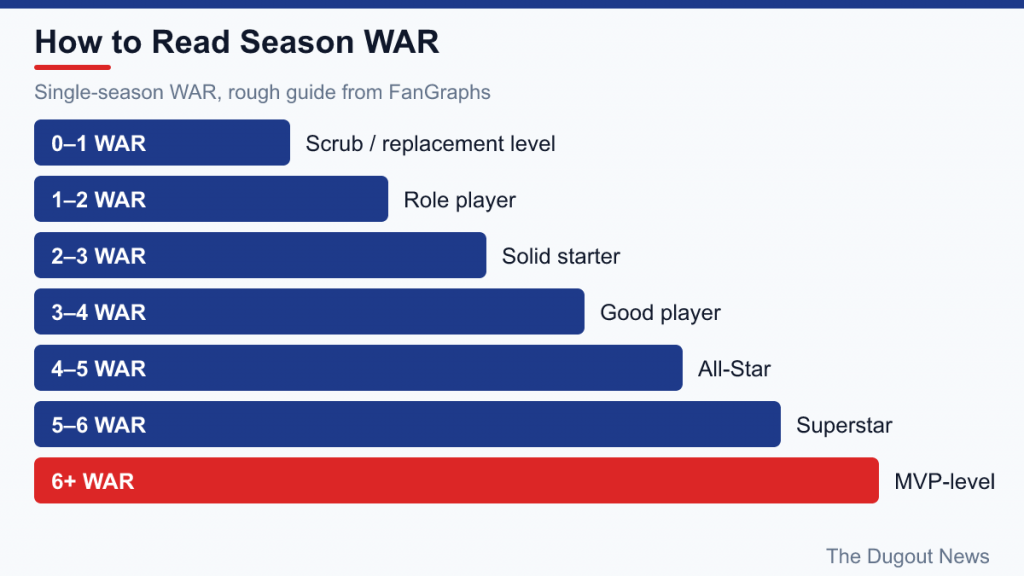
FanGraphs offers a rough guide for interpreting single-season WAR for position players and starting pitchers:
| Season WAR | Rough tier |
|---|---|
| 0–1 | Scrub / replacement-level |
| 1–2 | Role player |
| 2–3 | Solid starter |
| 3–4 | Good player |
| 4–5 | All-Star |
| 5–6 | Superstar |
| 6+ | MVP-level |
Some useful anchors from the same source: an average full-time position player is worth about 2 WAR, as is an average starting pitcher, and bench players typically land between 0 and 1.
WAR is also a counting stat, which means it accumulates with playing time. A player who misses half the season cannot reach the totals of a healthy everyday player, even if he was better on a per-game basis. When you want to compare rates, look at WAR per 600 plate appearances or per 200 innings, or compare players with similar playing time.
And yes, WAR can be negative. A player who performs below replacement level costs his team wins compared with a minor-league call-up. FanGraphs points to Neifi Perez’s -3.1 in 2002 as an extreme example.
The Limitations You Should Know
WAR is useful precisely because it is honest about being an estimate. Its main weaknesses are well documented:
- Precision is limited. FanGraphs explicitly notes that a 6.4 WAR season and a 6.1 WAR season are effectively indistinguishable. Treat differences of less than about a win as a tie.
- Defense is the shakiest component. Single-season defensive numbers are volatile, so players whose value comes mostly from their glove carry more uncertainty. Many analysts prefer to look at several seasons of defensive data before drawing conclusions.
- Catchers are hard to measure. FanGraphs acknowledges catcher WAR is the least precise, since parts of the catcher’s job, like game calling, are difficult to quantify.
- FIP-based pitcher WAR assumes average luck on balls in play. That can undervalue pitchers with a genuine skill for weak contact. FanGraphs also publishes a runs-allowed alternative (RA9-WAR) for this reason.
- It is context-neutral. WAR does not care whether a home run came in a blowout or a tie game in the ninth. That makes it good at measuring talent and contribution, but it does not capture “clutch” timing, which is part of why some writers resisted it in MVP debates.
- Cross-era comparisons are tricky. Critics, including Bill James, have argued that comparing players to their contemporaries can make early-era stars look more dominant than they would against modern competition.
How to Use WAR Well
Used thoughtfully, WAR is an excellent starting point. A few practical habits help:
- Start with WAR, then look underneath. Check which component drives the number. A 5-WAR shortstop built on elite defense is a different player from a 5-WAR shortstop built on hitting.
- Use multiple seasons. A three-year view smooths out defensive noise and fluky years.
- Compare like with like. Same source, similar playing time, similar role.
- Remember the error bars. Rank players in tiers rather than by decimal points.
- Pair it with other evidence. Scouting reports, rate stats and context all still matter.
Frequently Asked Questions
Is WAR an official MLB statistic?
No. WAR is calculated by independent analytical sites. There is no single official formula, which is why several versions exist.
Why does a designated hitter need to hit so well to post high WAR?
Because the positional adjustment for DH is the largest penalty on the scale. A DH contributes nothing on defense, so his bat has to carry all of his value.
Can I add up a team’s WAR to predict its wins?
Roughly. Since replacement level is set around a .294 winning percentage, about 48 wins plus the team’s total WAR gives a ballpark estimate of its win total, though sequencing, bullpen usage and luck create gaps between that estimate and the real standings.
Which version should I use?
Either is fine, as long as you are consistent. Many fans look at both and treat the range between them as the honest estimate of a player’s value.