ERA, WHIP and FIP: Pitching Stats Explained
How earned runs work, how ERA and WHIP are calculated, why FIP focuses on strikeouts, walks and homers, plus ERA+ and xFIP, and when to use each.

When a broadcast puts a pitcher’s numbers on screen, two statistics almost always appear: ERA and WHIP. Analysts add a third, FIP, and argue about which one tells the truth. Each measures something different, and each has blind spots. Knowing how they are built is the key to reading them correctly.
This guide starts with the foundation, the earned run, then works through ERA, WHIP, FIP and two useful relatives, ERA+ and xFIP.
First, What Is an Earned Run?
Under the Official Baseball Rules, an earned run is “a run for which a pitcher is held accountable.” Runs that score because of the defense’s mistakes are unearned and do not count against the pitcher’s ERA.
To decide, the official scorer reconstructs the inning as if there had been no errors or passed balls, always giving the pitcher the benefit of the doubt about which bases runners would have reached. If the run would have scored anyway, it is earned. If it would not have, it is unearned.
Key Rules
- Things that count against the pitcher: runs that score through hits, walks (including intentional walks), hit batters, sacrifices, stolen bases, fielder’s choices, balks and wild pitches. A wild pitch is considered solely the pitcher’s fault.
- Things that do not: a run is unearned if the runner reached on an error, reached because a muffed foul fly prolonged his at-bat, reached on interference or obstruction, or advanced because of an error or passed ball that was needed for him to score.
- The phantom third out: if an error extends an inning that should have ended, any runs scored afterward are unearned against the pitcher.
The rulebook gives a clear example. A pitcher retires the first two batters. The third reaches on an error. The next two hit home runs. Three runs score, but none is earned, because the inning should have ended on the error.
Inherited Runners
When a reliever enters with runners on base, those runners remain the responsibility of the pitcher who put them there. If they score, the runs are charged to the earlier pitcher. The rule charges each pitcher with the number of runners he left on base, not the specific individuals, so a force play that swaps one runner for another does not let the first pitcher off the hook.
Team vs. Individual Earned Runs
A reliever does not get the benefit of earlier chances for outs that the defense missed before he entered. As a result, a run can be earned against the reliever but unearned for the team. For example, if an error should have ended the inning and a reliever then enters and gives up a home run, the run is earned for the reliever but unearned for the team total.
The Extra-Innings Runner
In regular-season extra innings, a runner starts each half-inning on second base. For earned-run purposes, the rules treat him as if he reached on a fielding error, so if he scores, his run is unearned.
ERA: Earned Run Average
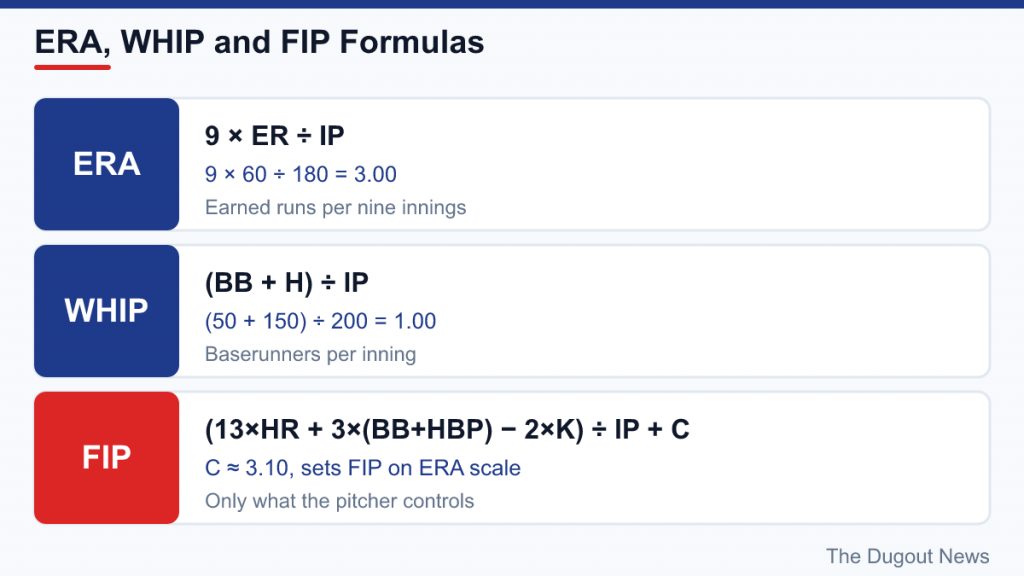
ERA measures how many earned runs a pitcher allows per nine innings:
ERA = 9 × Earned Runs / Innings Pitched
A pitcher who allows 60 earned runs in 180 innings has an ERA of 9 × 60 / 180 = 3.00. Remember that innings are counted in thirds: “180.2” in a box score means 180⅔ innings.
Henry Chadwick, the 19th-century writer who shaped early baseball statistics, is credited with devising the statistic. The National League first kept official ERA in 1912, and the American League later adopted it too. To win an ERA title in the majors, a pitcher must throw at least as many innings as his team’s scheduled games, which is 162 innings in a standard season.
What Is a Good ERA?
It depends on the era. During the dead-ball era, an ERA under 2.00 was considered good; in the high-offense late 1920s and 1930s, anything under 4.00 was respectable. In recent seasons, an ERA under 4.00 has again been considered good, and an ERA under 3.00 marks an excellent season. The single-season record is Dutch Leonard’s 0.96 in 1914; the lowest for a pitcher with 300 or more innings is Bob Gibson’s 1.12 in 1968; and the lowest career ERA belongs to Ed Walsh, at 1.82.
ERA’s Strengths and Weaknesses
ERA’s great strength is that it measures what matters most: runs. Its weakness is that runs depend on more than the pitcher. Defense turns some batted balls into outs and lets others drop for hits. A great defensive team will make its pitchers’ ERAs look better; a poor one, worse. Bullpens matter too, because inherited runners who score are charged to the pitcher who left them. And over a small number of innings, a few bloop hits can swing ERA dramatically.
ERA+: Putting ERA in Context
ERA+ (adjusted ERA+) scales a pitcher’s ERA to the league average and adjusts for the pitcher’s home ballpark. On this scale, 100 is league average and higher is better. A pitcher with a 150 ERA+ was much better than average; a pitcher at 80 was below average.
ERA+ is useful because a 3.50 ERA in a hitter-friendly park or high-scoring season can be more impressive than a 3.00 ERA in a pitcher’s park or low-scoring season. Like OPS+ for hitters, explained in our OPS and OPS+ guide, it lets you compare players across eras and teams.
WHIP: Walks Plus Hits per Inning Pitched
WHIP counts how many baserunners a pitcher allows per inning through walks and hits:
WHIP = (Walks + Hits) / Innings Pitched
A pitcher who allows 150 hits and 50 walks in 200 innings has a WHIP of 1.00. Hit batters and runners who reach on errors are not included. FanGraphs offers this rough scale, noting that league average changes from year to year:
| Rating | WHIP |
|---|---|
| Excellent | 1.00 |
| Great | 1.10 |
| Above average | 1.20 |
| Average | 1.30 |
| Below average | 1.40 |
| Poor | 1.50 |
| Awful | 1.60 |
WHIP is simple and popular, especially in fantasy baseball. FanGraphs notes that one bad defensive play can hurt a pitcher’s ERA more than his WHIP. But WHIP has clear limits: it treats a walk the same as a home run, and hits still depend partly on the defense. FanGraphs calls it “more of a quick reference statistic” than a tool for full analysis.
FIP: Fielding Independent Pitching
FIP takes a different approach. Instead of counting runs, it looks only at the outcomes a pitcher controls most directly, the ones that do not involve fielders:
- Home runs
- Walks
- Hit batters
- Strikeouts
The formula, as published by FanGraphs, is:
FIP = ((13 × HR) + (3 × (BB + HBP)) − (2 × K)) / IP + FIP constant
The weights reflect the run value of each event: home runs hurt most, walks and hit batters hurt, and strikeouts help. The FIP constant, generally around 3.10, is set each season so that league-average FIP equals league-average ERA. That puts FIP on the same scale as ERA: a 3.50 FIP can be read like a 3.50 ERA.
Why Leave Out Balls in Play?
Analysts found that pitchers have relatively little control over whether balls in play fall for hits. Some of that is defense, some is luck and some is batted-ball quality. FIP estimates what a pitcher’s ERA would look like with league-average results on balls in play and league-average sequencing of hits. FanGraphs also uses FIP as the foundation of its pitcher WAR; our WAR guide explains how that fits together.
Reading FIP
FanGraphs’ rough scale, based on the 2016 run environment, ranges from about 3.20 for an excellent FIP to 4.20 for average and 5.00 for awful. The most useful comparison, though, is FIP against the same pitcher’s ERA:
- ERA well below FIP: the pitcher may have benefited from good defense or good luck on balls in play, and his ERA could rise.
- ERA well above FIP: he may have been hurt by poor defense, bad luck or a leaky bullpen, and his ERA could improve.
FIP’s Limitations
- It is not adjusted for park or league; FIP- handles that, with 100 as average and lower being better.
- It works best over a season or more, not for single starts.
- Some pitchers consistently beat their FIP by inducing weak contact or limiting baserunners, although FanGraphs notes that such pitchers are rare.
xFIP: Normalizing Home Runs
xFIP, or expected FIP, goes one step further. Home run rates on fly balls bounce around from year to year, so xFIP replaces a pitcher’s actual home runs with an estimate: his fly balls multiplied by the league-average home-run-per-fly-ball rate, which is roughly 10 percent in most years.
xFIP = ((13 × (Fly balls × lgHR/FB%)) + (3 × (BB + HBP)) − (2 × K)) / IP + constant
According to FanGraphs, xFIP has one of the highest correlations with future ERA among pitching metrics. Its weakness is that some pitchers really do allow more or fewer home runs per fly ball than average, and xFIP assumes they do not. It is also available only from 2002, when reliable fly-ball data begins.
Which Stat Should You Use?
| Question | Best stat |
|---|---|
| How many runs did he actually allow? | ERA |
| How did he compare to his league and park? | ERA+ (or FIP-) |
| How many baserunners did he allow? | WHIP |
| How well did he pitch, independent of defense? | FIP |
| What might his ERA look like going forward? | xFIP, alongside FIP |
No single number is complete. ERA records what happened; FIP and xFIP estimate what should have happened based on the pitcher’s own contributions; WHIP is a quick look at traffic on the bases. Used together, they give a reliable picture.
Common Mistakes
- Judging a pitcher by ERA over a few starts. Small samples are noisy for every pitching stat.
- Treating unearned runs as irrelevant. They still count on the scoreboard, and some pitchers allow more of them than others.
- Comparing raw ERAs across eras. A 3.00 ERA meant very different things in 1914, 1930 and 2024. Use ERA+ for cross-era comparisons.
- Assuming a low FIP guarantees success. FIP is an estimate, not a promise.
You can compute ERA and WHIP for any single game straight from the pitching lines in a box score: earned runs, hits, walks and innings pitched are all listed there.